Tantalum is one of the most important biomaterials for surgical implants. However, little is known about how nanostructured tantalum surfaces affect cell morphology. We investigated mammalian cell morphology on tantalum-coated combs using high-resolution scanning electron microscopy and fluorescence microscopy.
The mechanisms of cell adhesion and the resulting morphologies on different surfaces are complex and often depend on multiple factors, such as the species of proteins adsorbed to the surface, surface structural geometry, roughness, and substrate surface energy.
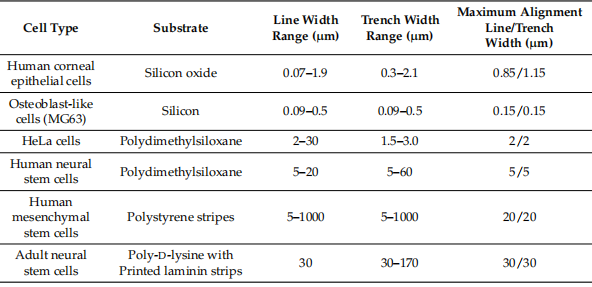
As can be clearly seen in Table 1, the sensitivity of cell morphology and cell arrangement varies significantly between cell types and substrate materials as a result of surface pattern geometry (eg, line and trench width).
Table 1. Results of cell alignment performance on different substrate materials and surface pattern designs
To understand how complex tantalum-coated nano- and micro-scale comb structures affect mammalian cell morphology and diffusion mechanisms. We chose tantalum for this study due to its wide range of applications in implants, mechanical strength, corrosion resistance, in vivo bioactivity and biocompatibility. Tantalum even surpasses titanium as the material of choice for some applications.
Materials and Methods
1. Tantalum comb structure
Tantalum thin-film-coated comb samples were fabricated on 200mm silicon wafers using advanced integrated circuit back-end processing methods. The fabrication steps for these silicon-based devices are briefly summarized and illustrated in Figure 1. Using photolithographic techniques, a parallel line-comb structure with equal-width trenches (T) and lines (L) was transferred to deposition on a silicon substrate on the silicon oxide film. The area of the rectangular comb-like structure is not less than 1.8 mm2 and the width is greater than 1 mm. A growth layer of tantalum and copper are deposited on these patterned surfaces, and chemical mechanical polishing is used to remove excess copper. The remaining copper was stripped by immersing the samples in about 9.4 M nitric acid for about 45 minutes, followed by rinsing with deionized water and ethanol. This acid stripper is a diluted solution from 70% Nitric Acid ACS Plus.
The fabricated lines and trench dimensions are summarized in Table 2. The trench depths for all patterned comb structures were fixed at about 700 nm.
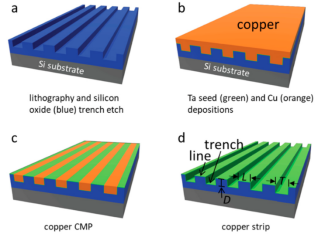
Figure 1. Schematic showing the fabrication of tantalum (green) comb structures. (a) The pattern is transferred onto the silicon oxide film using photolithographic techniques. (b) Deposition of tantalum and copper films on the etched pattern. (c) Use chemical mechanical polishing to remove excess copper. Strip the remaining copper with nitric acid. The comb-like structure contains lines (L) and grooves (T) of equal width. All trenches have the same depth (D).
Table 2. Data summary for the number of cells examined (n), the percentage of cell populations with 10♀>φ>10♀ on the horizontal axis, and the axial length ratio (L/S). The initial cell concentration of the medium used was approximately 0.5 × 10⁵ cells/ml. Data spread corresponds to one standard deviation.

2. Cell Culture and Sedimentation
Cells were cultured in equal volumes of medium and modified medium. The medium was supplemented with 4-methyl-L-glutamine and 10% fetal bovine serum. Cell culture was performed in 25 mL of medium using tissue culture-treated 175 cm² flasks at 37 °C in a 5% CO2 atmosphere. Decopper samples were sterilized with 70% ethanol solution for 30 s before inoculating cells. It was then rinsed with Dulbecco's phosphate buffered saline. Copper-stripped samples were then seeded at approximately 0.5 × 10⁵ –~ 1.0 × 10⁵ cells/ml and incubated in 6-well tissue culture plates for 0.5 to 24 hours at 37°C unless otherwise stated.
3. Cell Fixation and Staining Procedure
After the indicated incubation time, all tantalum samples with adherent cells were rinsed with d-PBS solution and fixed with 4% methanol-free formaldehyde solution for 1 h at ambient conditions. The fixed cells were permeabilized at a ratio of 0.1%. Triton-X 100 solution for 5 minutes. Samples were rinsed with PBS and blocked with 2 ml of 1% (by weight) bovine serum albumin. F-actin microfilament staining was performed by immersing specimens in dark red CytoPainter F-Actin stain solution diluted 1000-fold in 1% bovine serum albumin for 1 hour. DNA was stained with 0.4 µg/mL diamino-2-phenylindole solution (5 min). All staining procedures were performed in the dark to avoid photobleaching, and after each staining, samples were rinsed twice with 2 mL of dextrorotatory PBS. The final solution contains four drops of Prolong Gold Antifade Reagent.
4. Scanning Electron Microscopy
Before scanning electron microscopy, dehydrate the formaldehyde-fixed samples by successive immersion in ethanol solutions of increasing concentrations: 50%, 75%, 95%, and 100% (v/v). The samples immersed in 50% and 75% ethanol were kept in the solution for 10 minutes each. The final drying process is accomplished by soaking in two 10-minute steps in 95% and 100% solutions. Specimens were stored in a nitrogen box after drying. Cell cross-sections were performed by using the three-point bending micro-splitting technique under ambient conditions.
5. Adherent Cell Arrangement and Extension Characteristics
As shown in Figure 2, the orientation of adherent cells is characterized by the angle (φ) between the long axis of the nucleus and the spool of the comb. When the long axis of the nucleus is perpendicular to the line axis (y-axis), its angle is 90°, while the nucleus is aligned parallel to the line at an angle of 0°. Nuclear elongation is characterized by the ratio of the dimensions of elliptical nuclei along the major and minor axes. Elongated nuclei have large L/S values, while cells with perfectly circular geometries have a length ratio of 1.
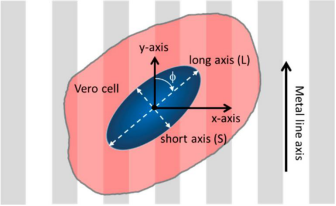
Figure 2. Schematic diagram of cells on patterned comb structures and their orientation and elongation parameters
Result
1. Cell arrangement and extension on patterned comb structures
Representative top-down SEM micrographs of the comb-like structures and adherent cells on the surface of the overlying tantalum film are shown in Figure 3.
Figure 4 shows photomicrographs of adherent cells on comb-like structures with line widths of 0.18, 10, and 50 μm. Nuclei (blue) and actin filaments (red) were stained with DAPI and penis-like protein conjugates, respectively .
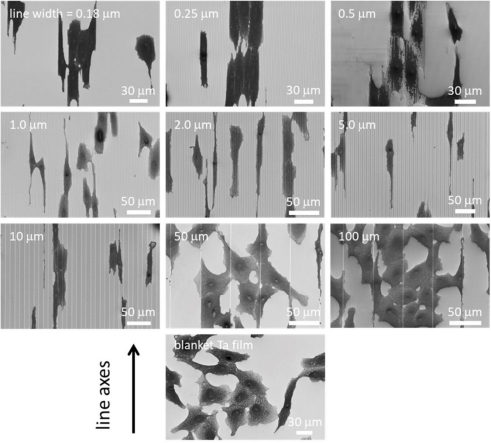
Figure 3. Representative top-down scanning electron microscopy (SEM) micrographs showing different comb-like structures and adherent cells overlying tantalum (Ta) membranes
The results showed that on structures with line widths of 0.18–10 μm, adherent cells were aligned with the spool. In contrast, the cells on the 50-µm and 100-µm structures did not align well with the spools—they resembled cells randomly distributed on the covering tantalum membrane. All cells were incubated on these specimens for 24 hours.
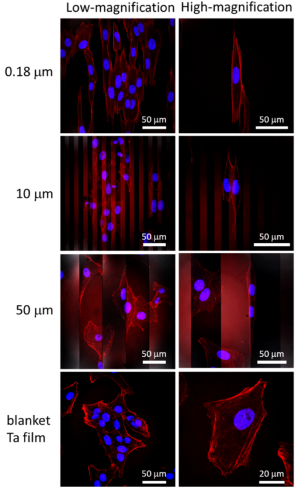
Figure 4. Typical fluorescence confocal micrographs of adherent cells overlaid on tantalum films and comb-like structures with linewidths of 0.18, 10, and 50 μm, respectively. Nuclei are blue and F-actin filaments are red (fluorescent penis protein conjugate)
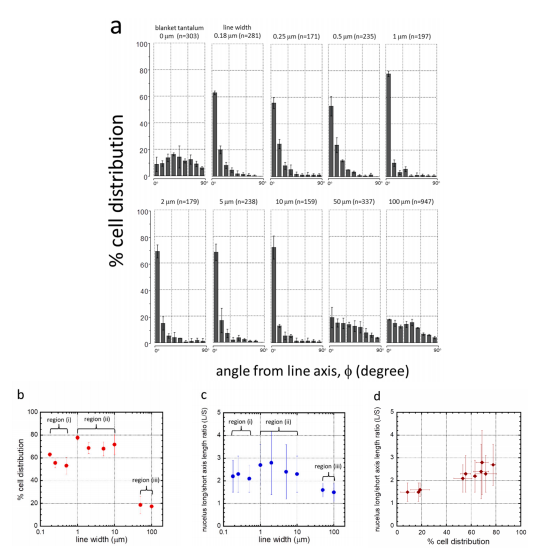
Fig. 5 Distribution of cell orientation (φ) percentage points at 0.18, 0.25, 0.5, 1, 2, 5, 10, 50
To quantify cell alignment and elongation behavior, the orientation of the nuclei relative to the spool (φ) and their dimensions were measured. Figure 5a shows the percentage of nuclei populations oriented at different angles to the spool. Samples with randomly oriented nuclei should have an equal distribution within each bin. The error bars shown in Figure 5a,b represent one standard deviation of the results for the three sets of random nuclei. shown in Figure 5c. The results showed that the nuclei were significantly elongated when cells adhered to the comb-like structures with line widths of 0.18–10 μm. shown in Figure 5d. The results showed that the average elongation of the nuclei also increased as more nuclei were aligned in a row axis.
2. Nanoscale Topography
The nanoscale cell morphology in the three cell arrangement regions (I) to (iii) was characterized using high resolution field emission scanning electron microscopy.
Typical 70° tilted SEM micrographs on wire-comb structures of 0.18, 0.25, 0.5, 1.0, 2.0, 5.0, 10, and 50 μm wide are shown in Figure 6. These high-angle tilted micrographs capture the pseudocytic periphery The three-dimensional shape of the foot.
Cells were sectioned by microdissection and examined with scanning electron microscopy. Typical 70° tilt micrographs of cross-sectional cells on 0.18 and 0.25 μm combs are shown in Figures 7a and 7b, respectively.
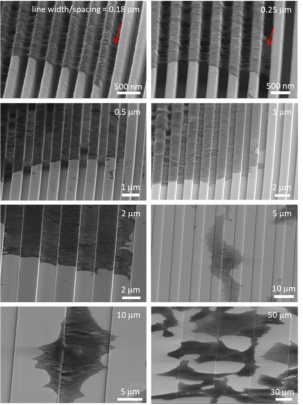
Figure 6. Scanning electron microscope photographs of 70 tilting of cells on comb structures with line widths of 0.18–50 μm.
Two distinct types of cell adhesion morphologies were observed: type 1 - adherent cells on 0.18 μm and 0.25 μm structures only contact the top of the wire but do not fill the groove gap, and type 2 - combs with wire widths greater than 1 m The cells on the like structures exhibit conformal surface coverage. Two morphological types of adherent cells were observed on 0.5 μm combs. All cells were incubated on the construct for 24 hours.
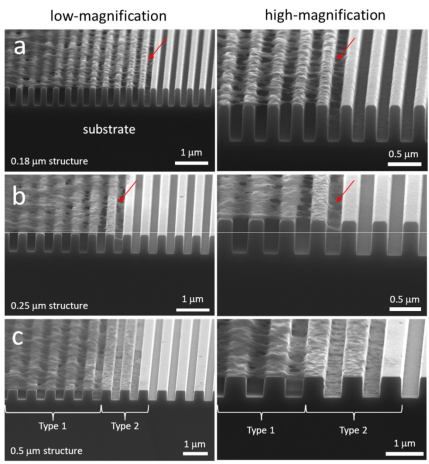
Fig. 7 Scanning electron microscope photo of 70♀ line width of slanted cross-section cells on the comb-like structure
(a) 0.18 μm, (b) 0.25 μm, and (c) 0.5 μm. Two distinct types of cell adhesion morphologies were observed: type 1 - adherent cells on the 0.18 μm and 0.25 μm structures only contact the top of the line but do not fill the groove gap; and type 2 - cells show conformal surface coverage. Two morphological types of adherent cells were observed on 0.5 μm combs. All cells were incubated on the construct for 24 hours. The cell concentration is approximately 5 × 10⁵ cells/ml.
3. Possible Cell Arrangement Mechanisms
A potential contributing factor to the elongated cell morphology shown in Figures 4–7 may be due to greater mechanical constraints on cell spreading in a direction perpendicular to the line. As the cell expands perpendicular to the spool, the cell assembly must overcome physical constraints by crawling up and down the trench sidewalls. These surface topographic features reduce the diffusion velocity and motility of cells in the vertical direction. In contrast, there are no topographically-induced constraints along the filament axis where cells are prone to spreading.
In conclusion
Attached mammalian cells elongate on tantalum-coated combs with line/groove widths ranging from 0.18 to 10 μm. As many as 77% of the nuclei were aligned with the spool. Cytopodia exhibit two morphologies, depending on the width of the lines and grooves. First, when the width is less than 0.5 μm, the nanoscale pseudopodia structure spans the trench without touching the bottom surface. Second, the cells fully conform to the surface topology on comb structures with wider line spacing. The results also show that a single cell can exhibit multiple morphologies when exposed to different engineered features simultaneously.